Bland–Altman plot
A Bland-Altman plot (Difference plot) in analytical chemistry and biostatistics is a method of data plotting used in analyzing the agreement between two different assays. It is identical to a Tukey mean-difference plot, which is the name by which it is still known as in other fields, but was popularised in medical statistics by J. Martin Bland and Douglas G. Altman.[1][2] It is important not to confuse Tukey Mean Difference Test (Bland-Altman test) with Tukey's Test/ Tukey's Method/Tukey's HSD test, which compares the means of every treatment to the means of every other treatment; that is, it applies simultaneously to the set of all pairwise comparisons.
Contents |
Agreement vs correlation
Bland and Altman make the point that any two methods that are designed to measure the same parameter (or property) will have a good correlation when a set of samples are chosen such that the property to be determined varies a lot between them. A high correlation for any two methods designed to measure the same property is thus in itself just a sign that one has chosen a wide spread sample. A high correlation does not automatically imply that there is good agreement between the two methods.
How to construct a Bland-Altman plot
Consider a set of n samples (for example, objects of unknown volume). Both assays (for example, different methods of volume measurement) are performed on each sample, resulting in 2n data points. Each of the n samples is then represented on the graph by assigning the mean of the two measurements as the abscissa (x-axis) value, and the difference between the two values as the ordinate (y-axis) value.
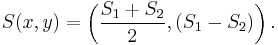
Hence, the Cartesian coordinates of a given sample S with values of  and
and  determined by the two assays is
Application
One primary application of the Bland-Altman plot is to compare two clinical measurements that each provide some errors in their measure.[3] It can also be used to compare a new measurement technique or method with a gold standard even so the interest of the Bland-Altman plot is contested in this particular case because the error pertains to the sole new measure. See Analyse-it or MedCalc for software providing Bland-Altman plots.
It is common to compute the limits of agreement during Bland-Altman analysis. This is usually specified as bias ± 1.96 STD (average difference ± 1.96 standard deviation of the difference).
See also
References
- ^ Altman DG, Bland JM (1983). "Measurement in medicine: the analysis of method comparison studies". Statistician 32: 307–317. doi:10.2307/2987937.
- ^ Bland JM, Altman DG (1986). "Statistical methods for assessing agreement between two methods of clinical measurement". Lancet 327 (8476): 307–10. doi:10.1016/S0140-6736(86)90837-8. PMID 2868172.
- ^ Hanneman SK (2008). "Design, analysis, and interpretation of method-comparison studies". AACN Advanced Critical Care 19 (2): 223–234. doi:10.1097/01.AACN.0000318125.41512.a3. PMC 2944826. PMID 18560291. http://www.pubmedcentral.nih.gov/articlerender.fcgi?tool=pmcentrez&artid=2944826.
External links
- Bland-Altman plot explanation with R statistical programming language.
- Bland-Altman plots using Analyse-it and Excel
- Bland-Altman plots using MedCalc
- Bland-Altman Analysis using SAS
- Bland-Altman analysis, with Lin's concordance coefficient, in Stata
- Martin Bland's home page - Design and analysis of measurement studies